


Metrics: System Signals
State, Trajectory, and Investment Metrics in Complex Systems


Signals
System signals come in many forms. Some give us information about the current state. Others bring light to the path we are on, helping to answer if that is the desired direction. While other signals reveal deeper impacts and investments that should be considered, showing how the choices we make affect both the people doing the work and those using the result.
In product creation, software development in this context, there is an endless appetite for metrics. Often directed at individual performance, things like developer productivity, rather than system health or product results. What if instead of measuring people, we listened to the signals our systems of work are sending?
State Metrics
State metrics tell you “what is” rather than “what might be” or “what should be”. It is simple counting of things that expose current reality without judgement.
Work-In-Progress (WIP)
Counting how many things are being worked on right now. It matters not what stage in the process this work is in, just that it is work attempting to flow through the system at any given moment.
This can be counted at various levels. For example:
Features being developed
Code changes in review
Items waiting for testing
Deployments in process
Seeing these counts can expose many potential things about the system of work, but gathering the data is still simple counting.
Features/Stories Delivered
A straightforward count of output - how many discrete pieces of work made it through the system and into the customers/users hands.
There is no consideration when collecting this data as to whether these discrete pieces of work are any good, solve problems, or provide that sought after and elusive value. Knowing the answers to those questions can be far more interesting than what this counting can provide.
Defect Count
Perhaps the simplest form of seeing the systems current quality state comes from counting how many known issues exist in the system at that moment. This includes issues found by the people doing the work and by those using the product produced by the system.
What is considered an acceptable defect count is another topic. Zero would be great though.
Active Branches
Potentially juicy metric here as this can provide information about the overall system of work. But it is still simple counting to gather this data.
Count how many active branches currently have ongoing development work.
For clarity, “development work” in this context is any work needed to create and deliver the product.
Active branches show the number of separate streams of code changes currently being worked on.
Other State Metrics
While many other simple counting metrics exist, the key is choosing ones that reveal something meaningful about your systems current state. These were chosen simply because some are obvious and others not so much. And if there are no current metrics, or the metrics being used aren’t providing meaningful information, these are good to start with, but not enough.
Trajectory Metrics
Trajectory, or directional [1], metrics provide some insights into which way the system is going.
“These metrics, for example, help show you if you’re making an improvement in an area, say, an increase in code coverage - how much of your code is actually covered in automated tests. If an organization or team is investing in test automation, an increase in code coverage could show that they’re getting better at it. It could show that the payoff is there.” - Stewart, D. and Tosi, J.
Code Coverage
Much debate about the value of code coverage as a useful metric. If a goal is set to have, for example 85% code coverage, rest assured there will be 85% code coverage or more. And that may be an indicator that we are getting better at testing our software and by relation improving quality. It may also be that the tests aren’t doing anything meaningful but are still satisfying the metric goal.
“Code coverage could be good. But if you’re testing things you shouldn’t test, or if it doesn’t help you increase your confidence in your code base, it’s not a good use of your money.” - Stewart, D. and Tosi, J.
The example below show’s tests that achieve high coverage.
Disclaimer: I make no claims or assertions that I create clean understandable code.
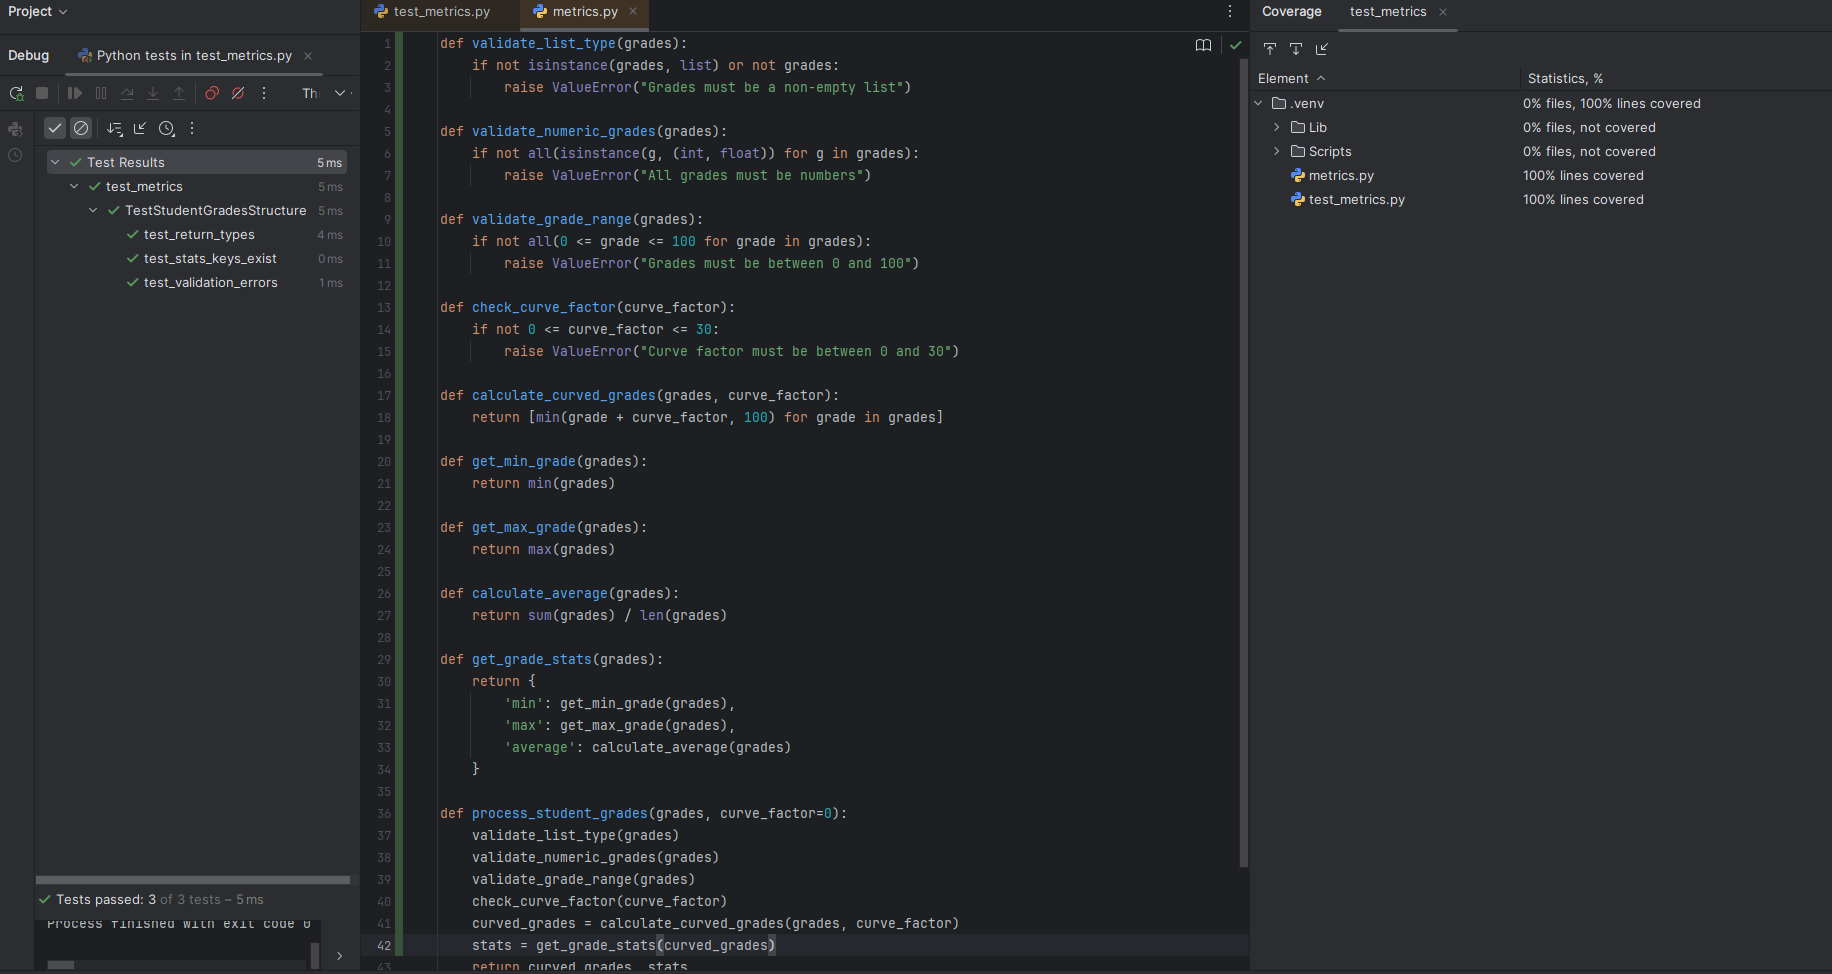
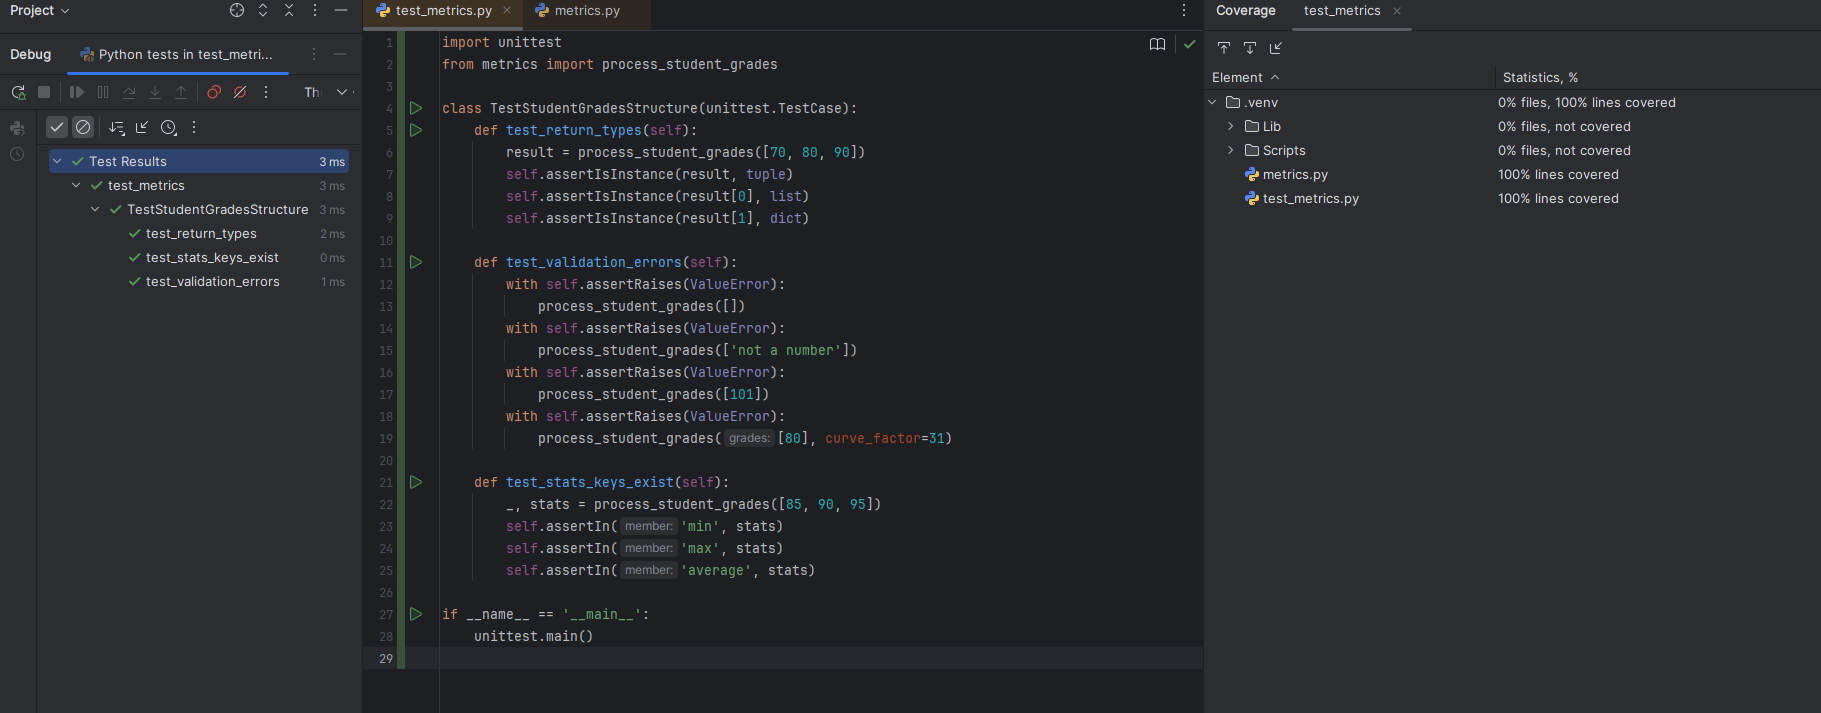
These tests are ineffective as they:
Only verify return types and structure
Don’t check if calculations are correct
Don’t verify the actual behavior
What these tests have achieved is 100% code coverage…
For fun, here are some behavioral tests to consider for this example.

Defect Discovery Rate
Tracks how quickly new issues are found in the system over time. This metric can uncover patterns in how problems surface. More interesting questions can be answered. Are we finding more or fewer defects over time? Are we finding defects in a specific pattern? Answering these can signal which direction system quality is trending.
More counting to get this data.
Capture the date each defect is found
Count new defects found over a time period (day/week/month)
Plot this count to see the trend
The formula would be Number of New Defects / Time period.
Week 1: 5 new defects
Week 2: 8 new defects
Week 3: 3 new defects
Week 4: 7 new defects
Defect Discovery Rate = 5.75 defects/week
A Shewhart Chart [2] [3], also known as a Process Behavior Chart, visualizes and helps separate signal from noise.

Deployment Frequency
While still simple counting, deployment frequency measures how often code changes are released to production over time. This helps to answer questions around if the delivery rate is stable, increasing, or decreasing.
Again, Process Behavior Charts (Shewhart Chart) are a good way to visualize this.

Considering Trajectory Metrics
Tracking and measuring defect discovery, deployment frequency, or code coverage are more about revealing patterns and trends in the system of work over time. These metrics, and others like cycle time, lead time, mean time to recover and more, can help determine the type of impact these changes are having and perhaps where the system needs attention.
While counting forms the basics of these metrics, the direction the system is heading is where the value comes from.
Investment Metrics
Investment metrics are about seeing things that effect the outcomes of the work we do. How we are impacting customers/users, the people doing the work, and costs. Measuring outcomes, impacts, and costs may not seem exciting or the kind of thing that a team should be concerned with. If this is your thinking:
“You’re wrong, and you should feel bad.” - David Batten
Ease of Work
Never heard of this one, no worries, think about what it is like to do work in your current system of work. What would it be like if that was easier? What might investing in that look like? How might this impact your customers/users? How might this impact the lives of the people doing the work? What returns or results might be gained by making it easier to do the work?
Quite a few questions, but far more interesting ones than say for example “How many story points did you complete this sprint?”
Measuring ease of work could be captured with more counting:
Time spent waiting for builds/tests
Frequency of merge conflicts
Build failure rates
Environment setup time
Other more interesting things to look at are around what some might call “development friction points”. Of course now this is thinking more about value streams and those are excellent to have. Lets just call this collaboration failure.
Time spent waiting on information is perhaps the most crucial thing we can easily change with the greatest return. If we make the information always available to the people doing the work, the quality of the work increases exponentially, let alone the great reduction in costs of waiting and misunderstanding.
Capturing this data can show the impact of collaboration failure. And makes the case for Software Teaming [4].
What is Software Teaming?
“All the brilliant minds working together on the same thing, at the same time, in the same space, and at the same computer.” We call it Software Teaming, also known as Mob Programming or Ensemble Programming. With large monitors, one computer, one keyboard, and a very collaborative approach, we use this method to supercharge our development efforts and deliver high-value software quickly.
Software Teaming is a software development approach where the whole team works together on the same thing, at the same time, in the same space, and at the same computer. This is similar to Pair Programming, where two people sit at the same computer and collaborate on the same code at the same time. However, with Software Teaming, we extend the collaboration to everyone on the team while still using a single computer for writing the code and doing other work.
In other words, this is an evolutionary step beyond the Extreme Programming concept of Pair Programming. We strive to accentuate and amplify concepts such as face-to-face and side-by-side communication, team alignment, collaboration, whole team involvement, continuous code review, and the “self-organizing team.” - Zuill, W. and Meadows, K.
“It would be better if everyone worked together as a system, with the aim for everybody to win.”
W. Edwards Deming
Ease of Use
How does the product we create impact customers/users? More counting but from a different lens.
User error rates
Task completion time
Navigation paths
Support ticket categories
Feature adoption rates
User session patterns
Abandonment points
These are examples of measuring how effectively users can achieve their goals with the product. How might making it easy for users to find what they need more directly, or which paths lead to successful outcomes impact the work we do?
What if there are features that generate support tickets? These features create more questions and confusion. How does our support model change over time by correcting these things?
How often do users give up and find another way? What are the things that trigger that and are they common?
Investing here can help determine which parts of the system have the greatest impacts. Revealing where any assumptions about ease of use might be wrong.
Summary
There is a temptation to measure everything possible. No matter which metrics are chosen, they should probably evolve over time as new things are learned. Consider choosing metrics that provide for asking and answering better questions about your system of work. Some metrics exist for vanity and reporting dashboards. Others help inform and make better decisions about the work and the real impact of the choices being made on both the people doing the work and those using the result.
Questions
What decisions do the metrics you have help you make?
What happens when we reduce the amount of failure demand? [5] [6] [7]
What metrics might reveal the true impact of your system on both users and the people doing the work?
Do the metrics in place reveal problems or just confirm what you want to hear?
What hidden costs exist in your current way of working? or;
How does collaboration failure impact the systems outcomes?
What might the system look like if the focus was on making the doing of the work easier?
Authors Note
During the creation of this article, much of the thought was around measuring systems, why we desire measurements (metrics), and what people are really after when seeking different measurements. A follow-up article will focus on motivations behind measurement and perhaps propose a different, dare I say better, way to have these conversations.
References
[1] Stewart, D. and Tosi, J., 2023 “Coaching for Learning: The Art and Practice”
https://www.dojoandco.com/book
[2] Shewhart, W.A., 1931, “Economic Control Quality of Manufactured Product”, Van Nostrand, New York
https://www.amazon.com/Economic-Control-Quality-Manufactured-Product/dp/1614278113
[3] Shewhart, W. A., 1939. “Statistical Method from the Viewpoint of Quality Control”, U.S. Department of Agriculture, Washington.
https://www.amazon.com/Statistical-Viewpoint-Quality-Control-Mathematics/dp/0486652327
[4] Zuill, W. and Meadows, K., 2022, “Software Teaming, A Mob Programming, Whole-Team Approach. Second Edition”
[5] Seddon, J., 1992, “I Want You To Cheat!: The Unreasonable Guide to Service and Quality in Organisations”
[6] Seddon, J., 2003 “Freedom from Command and Control: A Better Way to Make the Work Work”
Freedom from Command and Control: A Better Way to Make the Work Work
[7] Seddon, J., 2019, “Beyond Command and Control”